
Optimizing Agent Workflows
I spent 3 years at Cricket Wireless designing their customer service platform, Voyage. Serving over 2,000 agents across six countries, my work spanned the entire design spectrum—from modernizing legacy features that had remained untouched for years to integrating AI-driven workflows.
Every intervention was guided by a single North Star: reducing call handle time to drive operational savings while improving the agent experience.
CLIENT
Cricket Wireless
PRODUCT
Customer Service Platform
ROLE
As a design lead, I contributed to both strategic and hands-on levels


CONTEXT
Agents rely on Voyage to assist over 15 million customers
Cricket’s customer care operations handle millions of calls each year, where even a 1-second delay translates into ~$6,000 in annual cost. The goal of this project was to streamline high-volume agent workflows to reduce call handle time, increase accuracy, and improve service quality at scale.


Entities involved in the system

1. Reduce Operational Costs
Understand how the patient is doing, usually before interacting with the patient
2. Reduce Call Time
Streamline most common workflows, eliminate unnecessary navigation and manual processes.
3. Improve Agent Experience
Reduce cognitive load and decision fatigue to deliver confident customer service.
THE CHALLENGE
The costs behind calls were features that hadn't been touched in years


Top Call Drivers
1. Account Status
Customers call to cancel, suspend, or restore lines: actions not available through self-service channels.
2. Billing and Payments
Customers frequently call to understand complex bills, request payment plan changes, or resolve billing discrepancies.
WHY AGENTS STRUGGLED
Interfaces made simple tasks harder
The old interfaces forced agents to navigate multiple screens and rely on memory and manual steps, leading to longer calls and inconsistent experiences.
Change Subscriber Status
Multi-step navigation requires agents to remember complex sequences.


Billing History
Manual calculations and hidden transaction made it difficult to answer customer billing questions.
THE METRICS
9+ minutes on average for subscriber
status changes
Analytics revealed:
High abandonment rates
Extended time spent searching for specific information
Frequent back-and-forth navigation
Multiple page refreshes indicate confusion
Old Change Subsriber Status
WORKFLOW ANALYSIS
7 distinct steps explain agents’ struggle with simple status changes

EXPLORING INTERACTION PATTERNS
4 clinician interviews tested our initial wireframes, confirming research assumptions and the idea of having a customizable dashboard while uncovering new insights.
1. Enhanced Table
“This feels familiar, but better”
Familiar interface pattern, progressive disclosure reduced cognitive load
Still required agents to do multi-step processes
2. Scannable Visual Cards
“I can see everything at a glance"
Fast visual scanning, felt modern and approachable
Didn't reduce steps required, more lines can get overwhelming
3. Step-by-Step Wizard
“Too slow when I just need to suspend one line quickly"
Easy to follow, good for edge cases, context-aware actions
Felt tedious for simple status changes, time consuming for multi-line changes
4. Drag and Drop Kanban
“This makes so much sense! I can see exactly what's happening”
Intuitive understanding, visual gives instant context, eliminates navigation complexity
Limitations for bulk operations, potentially unfamiliar pattern for some agents
INTERACTION COMPARISON
Instead of improving how agents navigate to actions, what if we made the action the primary interaction?

THE INTERACTION REDESIGN
Line cancellation, Line restoration and Error Handling
Through A/B testing, we validated that agents rapidly adopted this new mental model, resulting in a significant reduction in average call handle time before the full-scale rollout.
Improved Change Subsriber Status
OUTCOME
Positive impact on key business metrics
28%
Improvement in average time spent on the change subscriber status page from 66 seconds to 47 seconds
78%
Decrease in the time taken to cancel a line from 580 seconds to 130 seconds
$20M
Reduction in operational costs annually for “account status” call reason
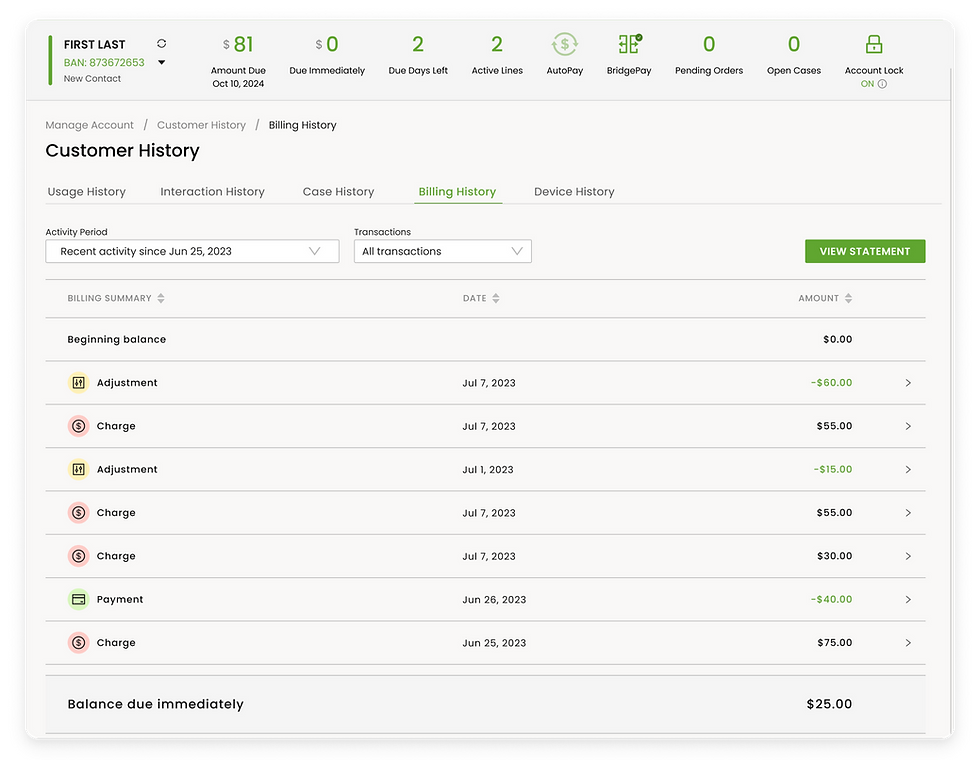
CHALLENGE #2: THE BILLING PROBLEM
Manual calculations and hidden information lead to call times of ~95 seconds
No search function
Complex navigation requiring multiple clicks
Mismatched header amounts
Buried account balance information
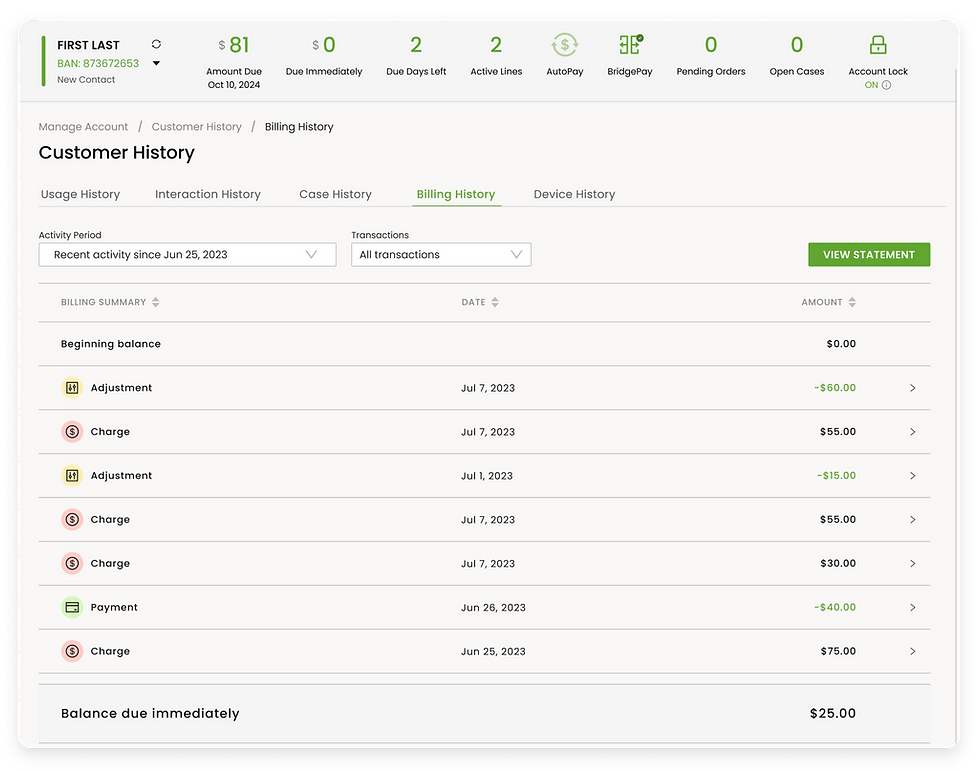
BREAKING DOWN THE BILL
View Bill History by
Filter Transactions
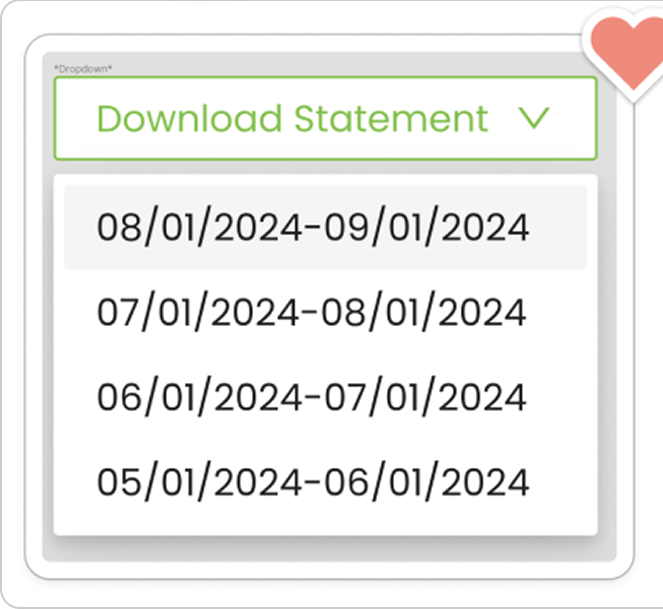
Download Statement

%201.png)


%201.png)


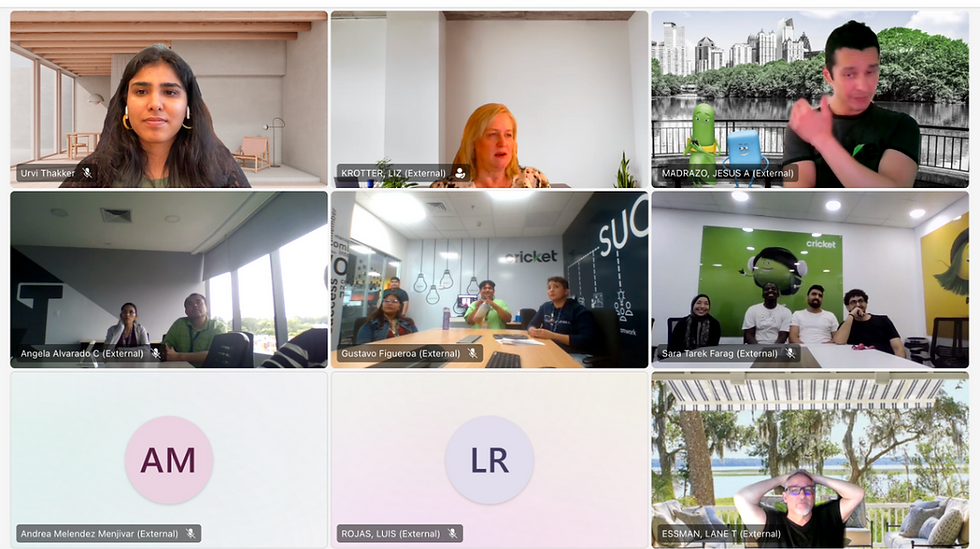
TESTING DESIGN ITERATIONS WITH AGENTS IN FOCUS GROUPS
By testing these prototypes with active agents, we were able to observe current pain points firsthand and refine the interaction model to better support their high-pressure environment.

4x4 PRIORITIZATION MATRIX
Facilitated a session with product owner and engineers to create incremental improvement plan balancing impact with development effort.

THE SOLUTION
Refinements that improved billing clarity
1. Showing Activity Upfront
Surfaced critical line items (like BridgePay and credits) directly on the main table to eliminate manual digging. This flattened hierarchy reduced interaction cost by 90% fewer clicks.
Simpler Data Presentation
Restructured Information Hierarchy
Refined Search and Filtering

New billing table
2. Introduced AI capabilities to view bill changes
This answers one of the most common questions asked- "Why is my bill different than the last month?" This instantly flags discrepancies between cycles and turns a complex 2-minute manual audit into a 5-second automated insight.
DIRECT FEEDBACK FROM THE AGENTS
Introduced a one-question survey with 5-star rating scale to measure agent satisfaction with billing improvements.

70%
rated between 3-5
30%
rated 1 or 2
DIRECT FEEDBACK FROM THE AGENTS
Facilitated sessions with agents who rated 1-2 stars
-
Integration of chargebacks, failed payments, and payment sources
-
Breakdown of BridgePay payments into first/second payments
-
Plan bundling to separate plan charges from add-ons.
-
12-month history
Focus group with agents who rated 1 or 2
POSITIVE IMPACT ON KEY BUSINESS METRICS
13%
Decrease in median time spent on the billing page from 38 seconds to 33 seconds
7%
Decrease in average call time to explain due date, balance from 585 seconds to 544 seconds
$4M
Reduction in operational costs annually
QUALITATIVE IMPACT
-
Agents report increased confidence in handling complex scenarios
-
Reduced training time for new hires
-
Improved customer satisfaction through faster resolution
KEY TAKEAWAY
Quantitative data helps bridge user and business goals
This project demonstrated how combining quantitative behavioral data with qualitative agent feedback drives informed design decisions.
-
Continuous feedback enables confident iteration over risky launches
-
Challenge the status quo as educated risks, not blind leaps
-
Design solutions to scale beyond their first use case
-
Small, continuous changes build big impact