
6-step guide to implementing UX metrics for your product
- Dec 7, 2025
- 8 min read
Published with Bootcamp on Medium

Measuring the impact of user experience (UX) on both users and the business is one of the most rewarding activities for a designer. We have all designed interfaces without user research or feedback, leaving us uncertain about the effectiveness, efficiency, and overall satisfaction of our work. I often wondered if my designs were truly making a difference. To see the real impact of my work, I began exploring UX Metrics and used Fullstory (a behavioral data platform) to apply them to a specific product.
It turns out, applying UX metrics to a redesigned feature resulted in an annual cost saving of $20 million for the company.
While the Fullstory platform didn’t directly provide this figure, the business’s data validated the insights we observed in Fullstory.
Seeing the benefits of a data-driven approach, I want to share why designers should adopt UX metrics, what UX metrics are, and how to get started.
Why UX Metrics
Adopting UX metrics practices can significantly enhance your understanding of user behaviors, evaluate user experiences quantitatively, identify actionable insights, and make data-driven decisions for product success. Here are a few reasons why I believe they are an invaluable addition to any product development process.
Evaluating the impact of the user interface
Imagine you are designing a Customer Relationship Management (CRM) used by call center agents to solve customer problems. For this product, the impact of a good user interface is in improving agent efficiency and reducing call time. By using metrics such as task success rates (how well users complete tasks), completion times (how long tasks take to finish), and error rates (how often users make mistakes), you can identify areas of usability improvement. By doing so, interface adjustments can be made to boost agent efficiency and reduce call times, ultimately saving money.
Understanding user behavior
While user interviews are great for understanding user behaviors, sometimes direct access to users isn’t possible. Some tools offer session viewing along with their metrics, giving you a backstage pass to user interactions. By watching these sessions, you can see how users navigate your product revealing user journeys, use cases, and pain points. For instance, through session analysis, I discovered that users repeatedly clicked on a button (rage clicks as shown below), leading to frustration. Addressing this improved the overall user experience.

Comparing old and new designs
When redesigning a feature, comparing it to the old version is essential to see if the changes are effective. Conducting UX audits and usability tests on the older design helps you gather baseline data. Ask questions like, how many steps or clicks does it take to complete the task? What are users clicking on the most? Are there any rage clicks, dead clicks, or errors? What is the task’s conversion rate? Answers to these provide a benchmark. Revisiting these questions after the redesign lets you quantify the improvements. Seeing conversion rates jump from 20% to 42%, can be a clear indicator of success, as shown in the image below.


Making data-driven decisions to justify future investments
Leveraging data insights not only enhances the user experience but also provides stakeholders with concrete evidence for investment decisions. Suppose you notice a low conversion rate for a common task, an increase in rage clicks on a button, or a spike in error notifications. In that case, you can drive informed decisions about design changes or feature enhancements.
Validating your work as a designer
As designers and developers, we often wonder about the impact of our work. Getting validation from the business or the team can be challenging. However, linking design changes to relevant metrics provides tangible evidence of our work’s influence.
“By measuring metrics that affect users satisfaction and business goals, we can effectively communicate the impact of our designs on the overall success of the project.”
What are UX Metrics
UX metrics are measurable data points that quantify how the user interacts with the product. They help designers, researchers, and product owners understand what’s working and what needs improvement to create better user experiences. Here’s a closer look at three types of UX metrics:
Performance Metrics
These metrics tell you how efficiently users can complete a task. Imagine you are using an app and you want to see how long it takes for a user to finish setting up their profiles. Performance metrics include:
Task Success Rate: How often users successfully complete a task.
Time Spent on Task: How long it takes users to finish a task.
Learnability: How quickly users learn to use the app.
Errors Made: How many mistakes users make while performing a task.
Self-Reported Metrics
These metrics capture users’ perceptions of your product by getting direct feedback from them about their experience. While or after interacting with a feature, you might ask users how they felt about it. This can be done through rating scales such as net promoter score (NPS) or after-scenario questionnaire.
Net Promoter Score (NPS): Asking users if they would recommend the product to others.
After Scenario Questionnaire: Asking users how satisfied they were with their experience after completing a task.
Behavioral and Psychological Metrics
These metrics can uncover the users’ unconscious behaviors and emotional engagement. Tools like eye tracking can show where users focus their attention, while skin conductance and pupillary response can reveal their emotional reactions.
Eye Tracking: Tools that show where users are looking on the screen.
Skin Conductance: Measuring how much users sweat to gauge their emotional response.
Pupillary Response: Observing changes in users’ pupil sizes to understand their emotional reactions.
If you want to read more on types of metrics, check out this article on Types of Metrics in the User experience.
Here’s another article on the List of UX Metrics.
How to get started with UX Metrics
Implementing UX metrics isn’t an exact science so there’s no one-size-fits-all approach. However, there are six steps to kickstart your journey in building UX metrics for your product.
1. Understand why measuring UX metrics matters
First, figure out why you want to measure UX metrics. Do you want to improve user satisfaction, increase efficiency, or achieve certain business goals? Defining your objectives will help you choose the right metrics. Here are some examples of what could be important for your product:
Uncover User Behavior and Challenges: Learn how your users interact with your product and identify any challenges they face.
Compare Task Completion Times Across Designs: See if your design changes make tasks faster for the user by comparing the time users take to complete tasks in different versions of your product.
Spot Usability Errors Early On: Identify and address usability issues proactively to ensure a smooth user experience and prevent user frustration.
2. Research existing UX Metrics materials and frameworks
Look into existing frameworks and tools, such as Google’s HEART framework or VMware’s USER metrics. See which ones align with the goals identified in Step 1. Not all metrics from a framework will apply to your product, so pick what’s relevant. For example, Google’s “Engagement” metrics may not fit a CRM product, but “task success” could be useful for measuring how efficiently users complete tasks.
It’s also helpful to explore similar projects, ongoing initiatives, and tools that have been effective within your organization. You may discover that your organization already has access to some tools that can be used for UX metrics but have not been fully utilized.
This step helps you understand what’s available and prepares you to implement it in the subsequent steps.
Here’s an article about some of the common metrics and frameworks: The A-Z of UX Metrics
3. Identify what to measure
Identifying what to measure can be challenging yet exciting. Below is a framework I created to guide you through this process.
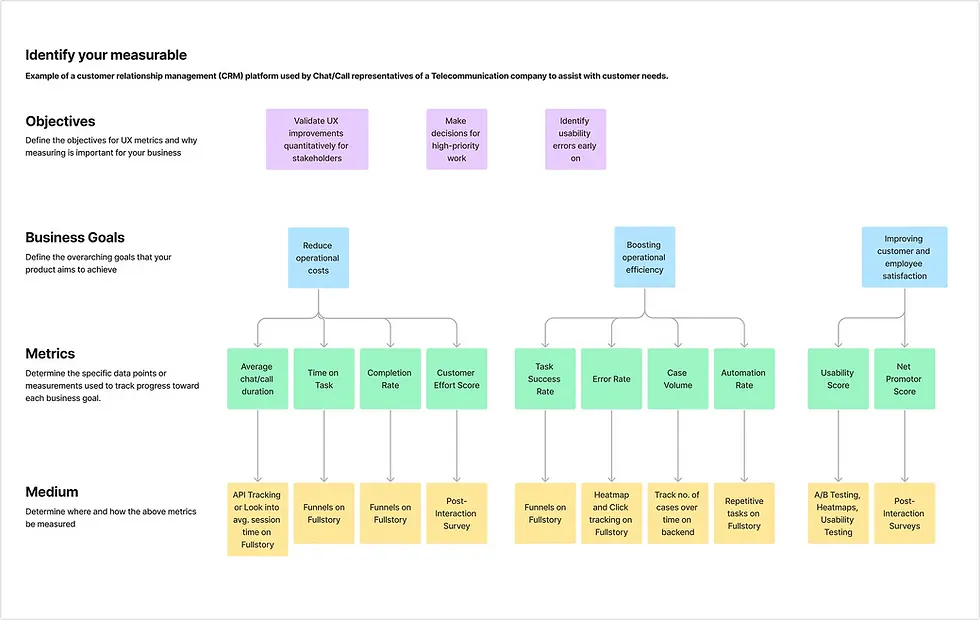
Start by defining objectives for UX metrics and decide as a team what you want to achieve. After implementation, ask yourself whether the objectives were met- Did this practice help me communicate improvements to the stakeholders?, Did it help me make decisions for high-priority work?
Next, define your product’s business goals, providing high-level guidance for selecting relevant metrics. Ensure that the metrics selected support these goals. For example, in a CRM platform, if your business goal is to reduce operational costs, you might measure time on task and completion rate”. For an e-commerce site aiming to increase average order value, bounce rate and ease of use would be key metrics.
4. Explore Mediums to Collect Metrics
In this step, consider where and how you will measure the metrics. Tools such as Fullstory and Microsoft’s Clarity can track specific touch points on your product, analyze user engagement through session replays, and click and scroll maps. Alternatively, Google Analytics is great for marketing metrics and conversion rates.
Check what tools your organization has and how you can use them effectively. Depending on what needs to be measured, usability testing tools or surveys can also be valuable options. Survey methods like Customer Satisfaction Score (CSAT), Emotional Rating, Customer Effort Score, and Net Promotor Score (NPS) can give you direct feedback from the user. They can be conducted in formats ranging from detailed questionnaires to one-question surveys like — How would you rate your flight booking experience?
5. Build metrics and dashboards
Move on from strategy to action, and start setting up the metrics chosen. Make sure you know exactly what you are measuring. Are you tracking how many users encounter a specific event, or how often that event happens? For example, do I see how many users clicked on the submit button, or how often the button was clicked on? Also, consider the time frame for data collection — daily, weekly, or monthly.
Next, create dashboards to track these metrics in real time. A dashboard would consolidate all relevant metrics you wish to monitor together. One dashboard could show daily metrics like visitor count and purchase conversion rate, while another dashboard might focus on specific features such as billing and payments as shown in the image below.
Beyond metrics, funnels are visuals across specific user journeys to identify where users drop off. With funnels, you can identify potential roadblocks that might be getting in the users' way.

6. Analyze insights and plan improvements
With metrics and dashboards in place, start analyzing insights to drive continuous improvements and ensure that your product evolves in line with user needs and business objectives.
There are several ways of analyzing insights depending on the nature of the metric. Suppose you are looking into visitor count, you might find that most visitors come between 6 pm and 9 pm. This could lead you to launch limited-time deals during those hours. Similarly, if you notice many returning visitors, you might brainstorm strategies to attract new users. What’s fun is how the same data can lead to different analyses and solutions.
Some insights are straightforward, like a spike in errors. Others might require deeper analysis, such as watching sessions to understand why users aren’t completing certain steps. Tools with session viewing capabilities can help you see where users are getting stuck and why.
The framework I have shared provides a structured way to align your UX efforts with your business goals, however, it’s not a rigid path that everyone must follow. Think of this as a guide to help you get started.
Your journey of implementing UX metrics will be iterative and dynamic. Experiment with different metrics and tools to find what works best for your product and team. It is through trial and error that you will uncover the most valuable insights.
By embracing UX metrics and adopting a data-driven approach to decision-making, you can create better user experiences, drive business success, and ultimately, impact the world of product design and development.
So go ahead, dive in, and start experimenting. Your users and your business will thank you.


Comments